GRAPH: Climate heating

William Bossen via Unsplash
Below is a graph of land and sea temperatures from 1950 to 2018. Summarise the information by selecting and reporting the main features, and make comparisons where relevant.
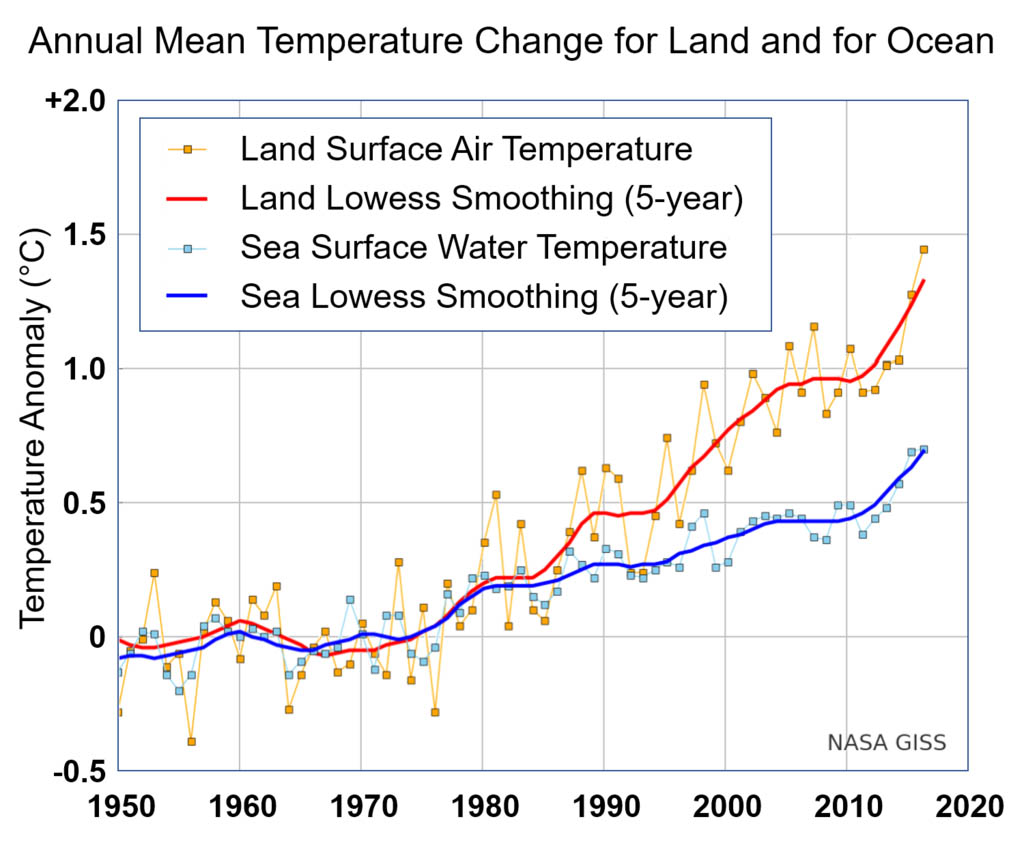
*Lowess smoothing = averaging scatter plot values over a certain span to create a smooth line.
[Image by NASA via Wikimedia]
Try Poligo now for free
Get help with your English writing from professional teachers 24 hours a day. We'll correct your writing and give you lots of useful advice and feedback. Poligo's service is super fast — if you don't get help in less than 24 hours, you get your money back. It's free to join & new members get 500 characters of writing checked for free.
- Fast service.
- 100% private.
- Professional quality.
Articles
Blog
- Goodbye for now
- Daily Habits That Improve Your Writing Over Time
- Business Writing Tips for Non-Native English Speakers
- Why Business Professionals Must Write Well - AI Can't Do It for You
- Meet Our New Writing Coaches!
- Understanding TOEIC
- Writing well is still essential in today's world!
- Currency & Price Changes
- Which is the right English Test for you?
- Poligo's 10-minute Writing Lessons