GRAPH: 2017 carbon dioxide emissions worldwide

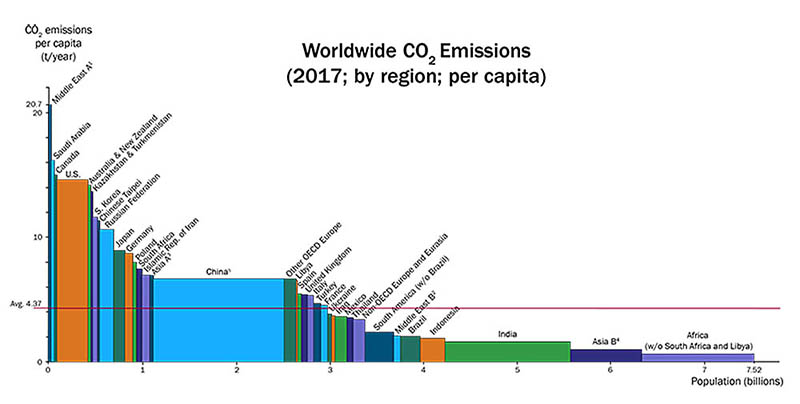
Below is a graph of carbon dioxide emissions per capita for different regions of the world. The total emissions of a region is represented by a rectangular area. The height of each rectangle is proportional to the emissions per capita, and the width is proportional to the population of the represented region. The regions are sorted by emissions per capita, from the highest to the lowest.
Summarise the information by selecting and reporting the main features, and make comparisons where relevant.
Try Poligo now for free
Get help with your English writing from professional teachers 24 hours a day. We'll correct your writing and give you lots of useful advice and feedback. Poligo's service is super fast — if you don't get help in less than 24 hours, you get your money back. It's free to join & new members get 500 characters of writing checked for free.
- Fast service.
- 100% private.
- Professional quality.
Articles
Blog
- Goodbye for now
- Daily Habits That Improve Your Writing Over Time
- Business Writing Tips for Non-Native English Speakers
- Why Business Professionals Must Write Well - AI Can't Do It for You
- Meet Our New Writing Coaches!
- Understanding TOEIC
- Writing well is still essential in today's world!
- Currency & Price Changes
- Which is the right English Test for you?
- Poligo's 10-minute Writing Lessons